Data item widget types
Data can be presented in various widget types. The widget types available will be appropriate for the type of data being presented.
The availability of certain types of widget may be restricted due to the available space on the data page. If the desired widget type is grayed out, try making more space on the page for the widget.
The widget types available vary depending on data item.
The following widgets may be available:
Icon |
Description |
|---|---|
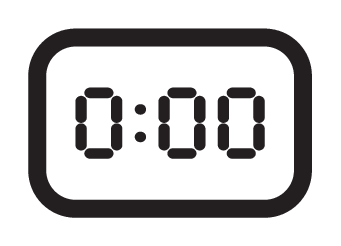 |
Digital View data as a numeric value. |
 |
360° gauge View data in a full circle gauge with a needle indicating the current value. The 360° gauge widget type is only available for preset gauges. |
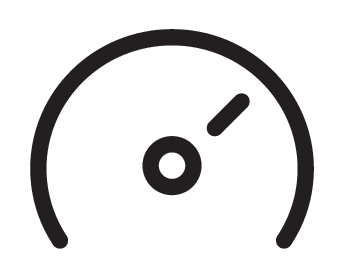 |
270° gauge View data in a three quarter circle gauge with a needle indicating the current value. |
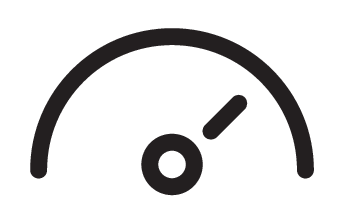 |
180° gauge View data in a half circle gauge with a needle indicating the current value. Orientation The 180° gauge is available in Up, Down, Left, and Right orientations. |
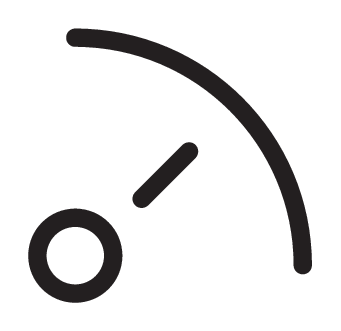 |
90° gauge View data in a quarter circle gauge with a needle indicating the current value. Orientation The 90° gauge is available in Left and Right orientations. |
 |
Graph (horizontal) View data in a time graph. Data is plotted from right to left. |
 |
Graph (vertical) View data in a time graph. Data is plotted from top to bottom. |
 |
Level View data in a level meter that shows the current value relative to full (top) and empty (bottom). |
 |
Level group View data from multiple sensors in level meters that show the current values relative to full (top) and empty (bottom). |
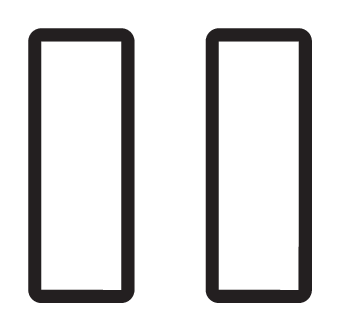 |
Trim tabs View a visualization of trim tab position relative to up (top) and down (bottom). |
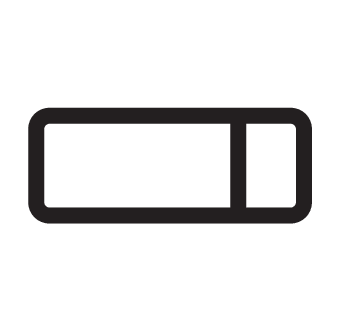 |
Rudder bar View a visualization of rudder position. Wind shift bar View a visualization of wind shift. |