Tide station information
Depending on your cartography, Tide station information may be available.
Tide station symbol
ChartTide station |
The location of Tide stations is marked on the chart using a diamond-shaped symbol with a ‘T’ in the middle.
|
Dynamic tide graphic
Using Navionics cartography, when the Tides is enabled () the tide symbol is replaced with a dynamic tide height graphic:
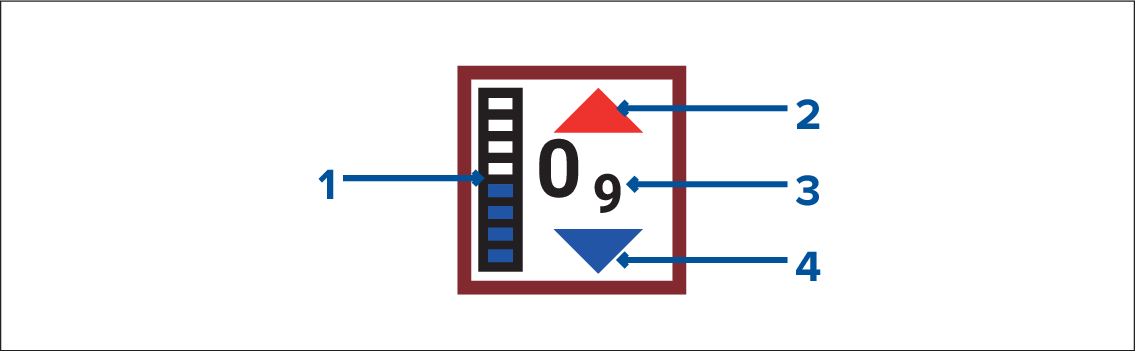
ChartTide barTide bar — The tide bar plots the current tide height against the maximum predicted tide height for that day.
Red arrow indicates tide height is increasing.
Tide height — Tide height is displayed in user-selected depth units, with decimals displayed in subscript. Decimals are not shown for values of 10 or greater.
Blue arrow indicates tide height is decreasing.
Tide graph
ChartTide graphTide graphs are available with compatible cartography by selecting more options and then Tide station from the tide station’s context menu.
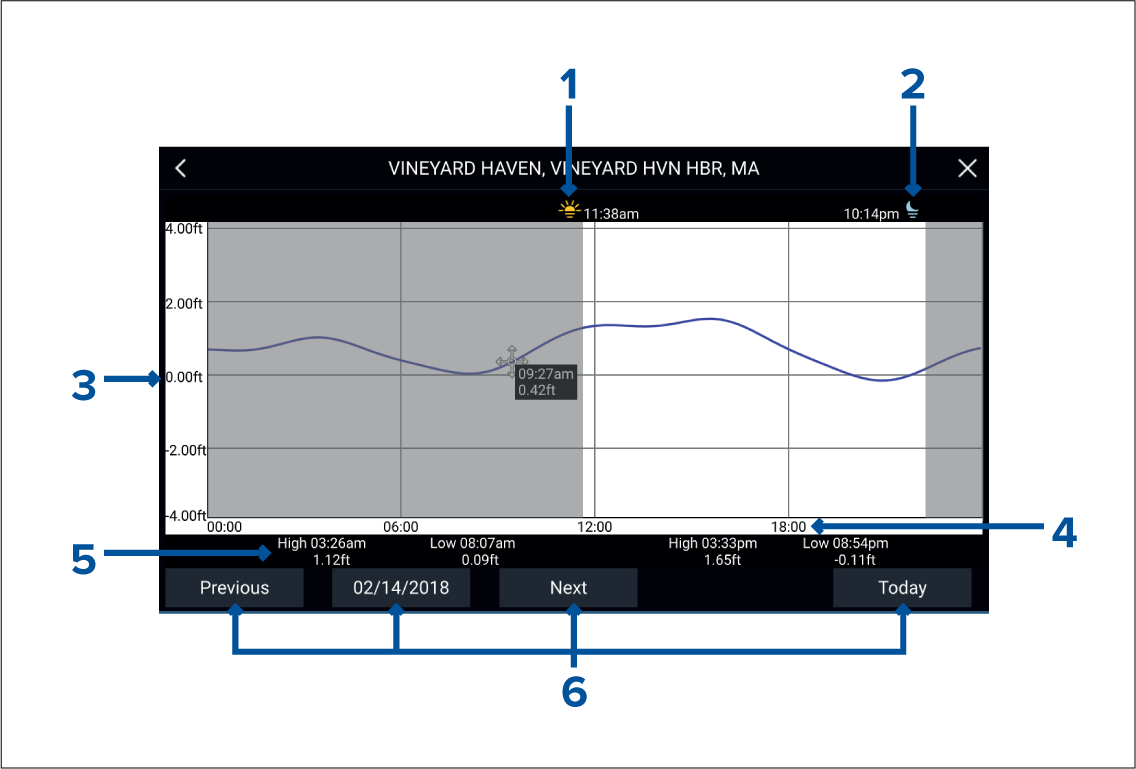
Sunrise — Indicates time of sunrise.
Sunset — Indicates time of sunset.
Height — Provides tide height in selected units.
Time — Indicates time of day.
Low / High tide — Indicates the time of low and high tides.
Time and date options — Use the buttons to view previous, next or today’s tide predictions, or enter a date by selecting the date field.