Navionics dynamic tide graphic
When the Tides layer is enabled or when the Chart app is in Tides mode, the standard Tide station symbol is replaced with a dynamic Tide height graphic:
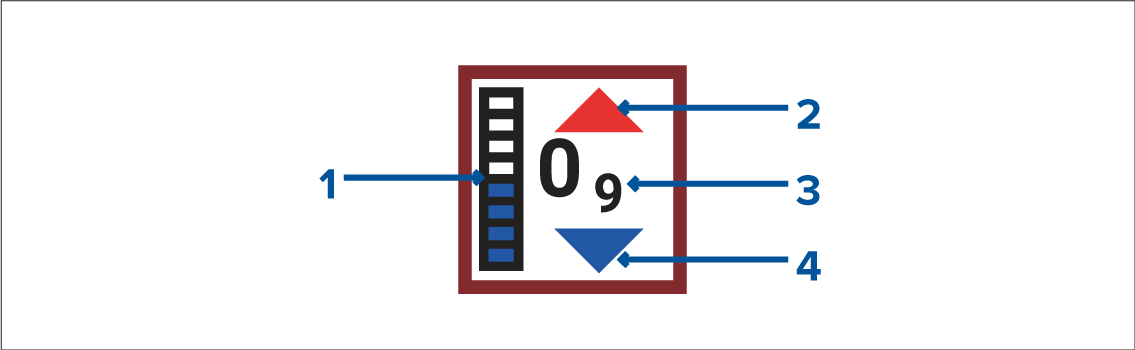
ChartTide barTide bar — The tide bar plots the current tide height against the maximum predicted tide height for that day.
Red arrow indicates tide height is increasing.
Tide height — Tide height is displayed in user-selected depth units, with decimals displayed in subscript. Decimals are not shown for values of 10 or greater.
Blue arrow indicates tide height is decreasing.