Limiting data display limits
By default the displayed data limits will cover the full range of received data. Upper and lower limits can be specified manually for SST contour, 30M sub surface sea temperature and height anomaly layers.
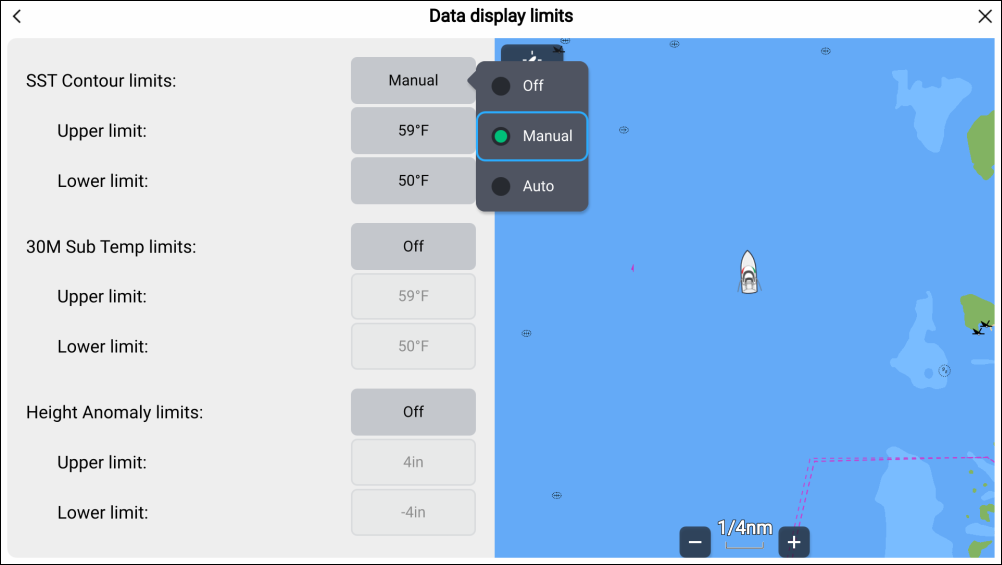
- Select Data display limits from the Chart app menu.
- Select the relevant option field, either SST Contour limits, 30M Sub Temp Limits or Height Anomaly Limits.
- Select Manual from the pop-over options.
- Adjust the Upper limit and Lower limit fields as required.
The Manual option will limit the displayed data to the specified range. Setting a data limit option to Auto will filter the data according to the data limits received by your Sirius receiver.
You can revert to displaying the full range of received data by switching the option to Off.
When manual limits are applied ‘(Limits ON)’ indication is displayed against the layer in the legend and in the status area at the bottom left of the chart app.