Wind shift data
As True Wind Direction (TWD) is constantly changing, the position of the laylines changes over time. These changes are shown as lighter colored shaded triangles which represent the variation of TWD over a specified time period.
LaylinesLaylinesWind shifts
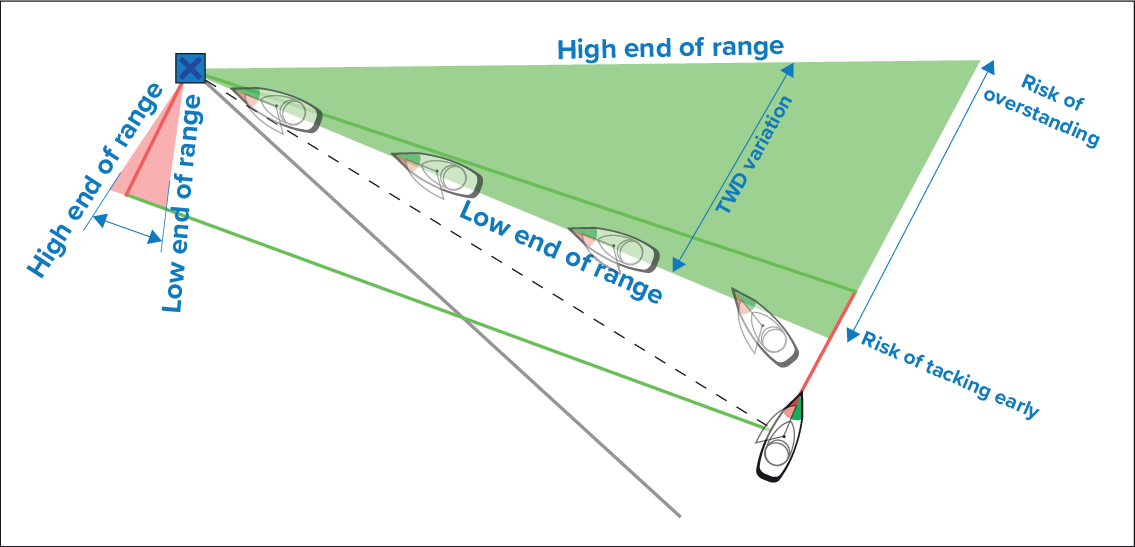
Figure 1. Variation — Low end of range
In the illustration, the dashed line represents the (theoretically) ideal route to the mark (i.e. the shortest course).
With TWD holding at the low end of its range of variation, the vessel can tack to starboard and will lay the windward or leeward mark as it enters the shaded area. However, if TWD shifts back towards the higher end of its range of variation, the vessel will overstand the windward or leeward mark and may need to travel farther to reach the waypoint.
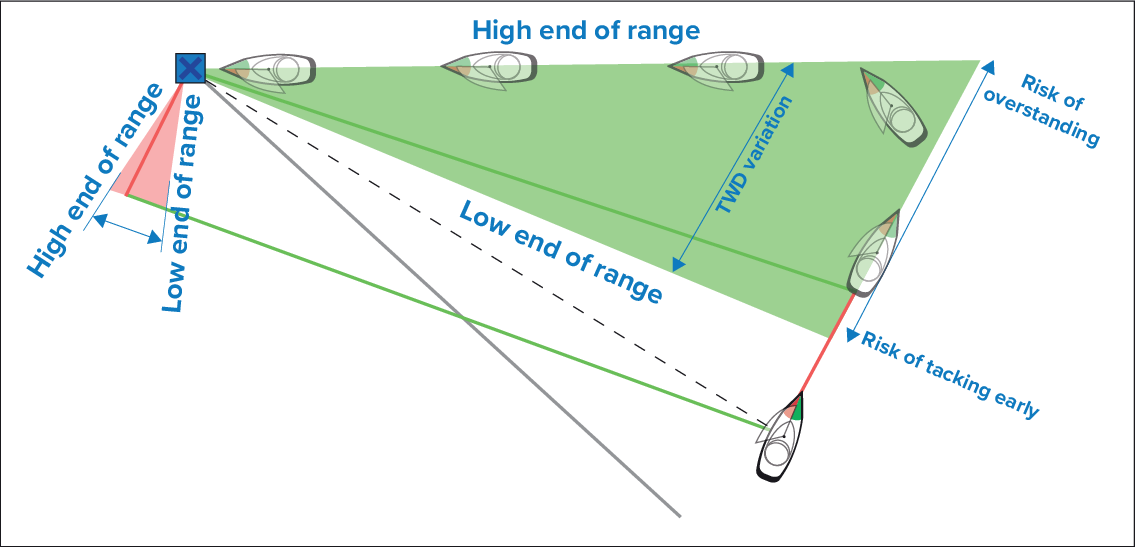
Figure 2. Variation — high end of range
In the illustration, the dashed line represents the (theoretically) ideal route to the mark (i.e. the shortest course).
With TWD holding at the high end of its range of variation, the vessel can tack to starboard and will only lay the windward or leeward mark as it reaches the end of the shaded area. However, if TWD shifts back towards the lower end of its range of variation, the vessel will fall short of the layline and may have to perform extra tacks to reach the waypoint.
Depending on the situation, the normal course of action may be to tack when the vessel is halfway through the shaded area. However this may not be the shortest or quickest route.
Wind shift settings
Wind shift data settings are available from the Laylines settings page:
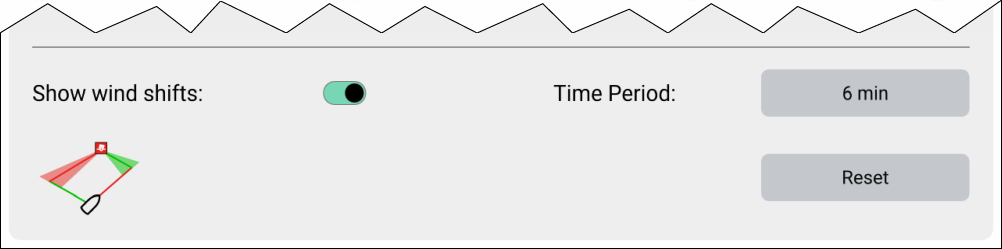
Show wind shifts — Toggle wind shifts ON / OFF
- Time Period — Select the time period that you want the wind shift data to cover. The available options are:
3 min
6 min
12 min
30 min
60 min
Reset — Reset the recorded wind shift data