SideVision overview
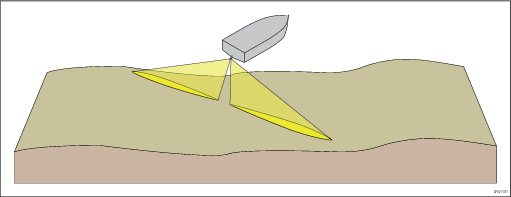
Figure 1. SideVision™ beams
The transducers send pulses of sound waves into the water on each side of your vessel, and records the sound waves that are reflected off objects suspended in the water column and the bottom,, known as sonar returns. The sonar image is constructed line-by-line, similar to the way a television picture is composed of many horizontal lines. Each successive ping from the transducer adds a new line of image data to the top of your display. Each new line shows sonar returns from both the port and starboard sides of your vessel. As new lines are added with each successive ping, older data gradually scrolls down the display, building up a detailed image of the water column and bottom to the sides of your vessel. If your vessel maintains the same bearing and speed for a period of time, you can interpret the image as a plan of the bottom along your vessel’s course. SideVision™ is effective at lower vessel speeds.
SideVision™ does not provide direct depth readings. The scale shown across the top of the image indicates the distance of features from your vessel.
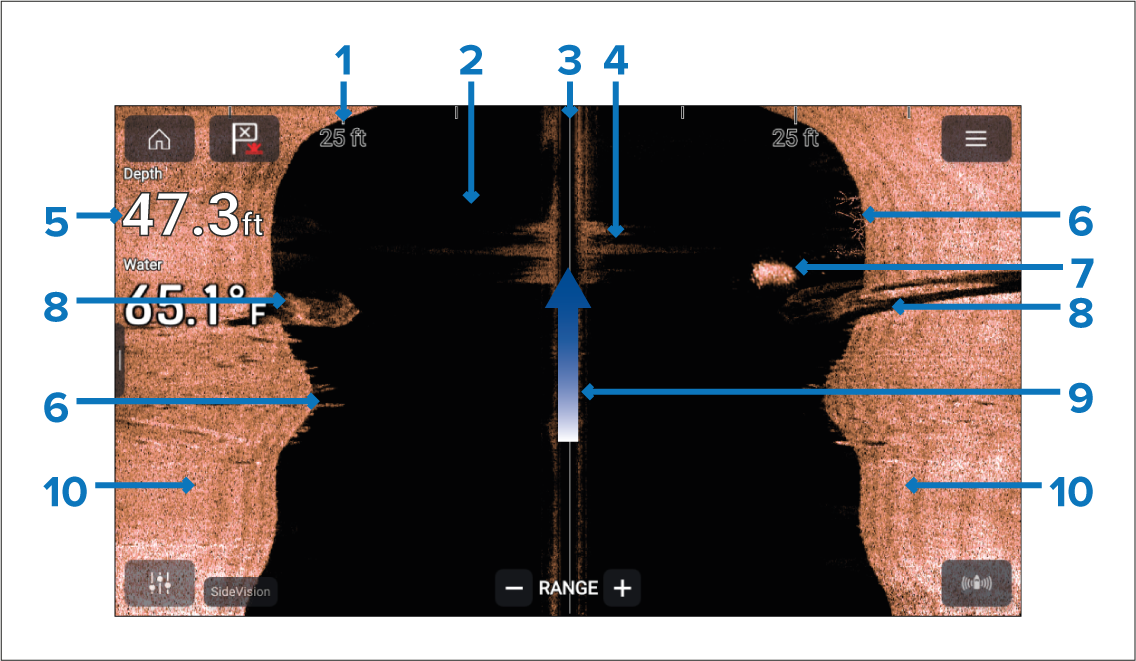
Figure 2. SideVision™ screen interpretation
Range scale — The range scale indicates distance (range) to port and starboard from your vessel.
Water — Using the default color palette black indicates no sonar returns i.e.: clear water.
Centerline — The solid line represents the centerline of your vessel. left of the centerline represents the water, objects and bottom to the port side of your vessel, right of the centerline represents the starboard side.
Turbulent water — turbulence in the water caused by such things as vessel wake can produce a sonar return due to the aeration in the water.
Water depth — When using a separate depth transducer current depth can be displayed in a data overlay.
Vegetation — Examples of vegetation growth (e.g: trees) on the bottom.
Bait ball — Example of a bait ball at an approximate distance of 18.5 ft from your vessel.
Structure — Example of bottom structure. Underwater structures such as pipelines, piers and other large solid structures may cause an area of shadow directed away from your vessel’s direction.
Vessel direction — Vessel direction of travel. The sonar image will scroll from top to bottom as your vessel moves.
Bottom — Solid mass indicating the bottom, using the default color palette the bottom is colored copper. It may be possible to identify the transition of bottom material (e.g.: where an area of mud meets an area of gravel).